
Video: https://youtu.be/ogH19jcLQK0
The analysis of Columbia’s graduate STEM diversity (1994-2016) lends itself to ScrollyTelling through these narrative layers:
Contrasting Currents Beneath Stagnation
A scrolling header would reveal the apparent flatline (female representation frozen at 1998 levels) before plunging into turbulent subsurface trends. An animated Sankey diagram could split into seven discipline streams, each pulsing with distinct energy patterns.Engineering’s Divided Journey
Interactive sliders would let viewers:
- Drag through years to see biomedical engineering’s female population surge 400% (2010-2016)
- Watch mechanical engineering’s gender gap widen despite 3x enrollment growth
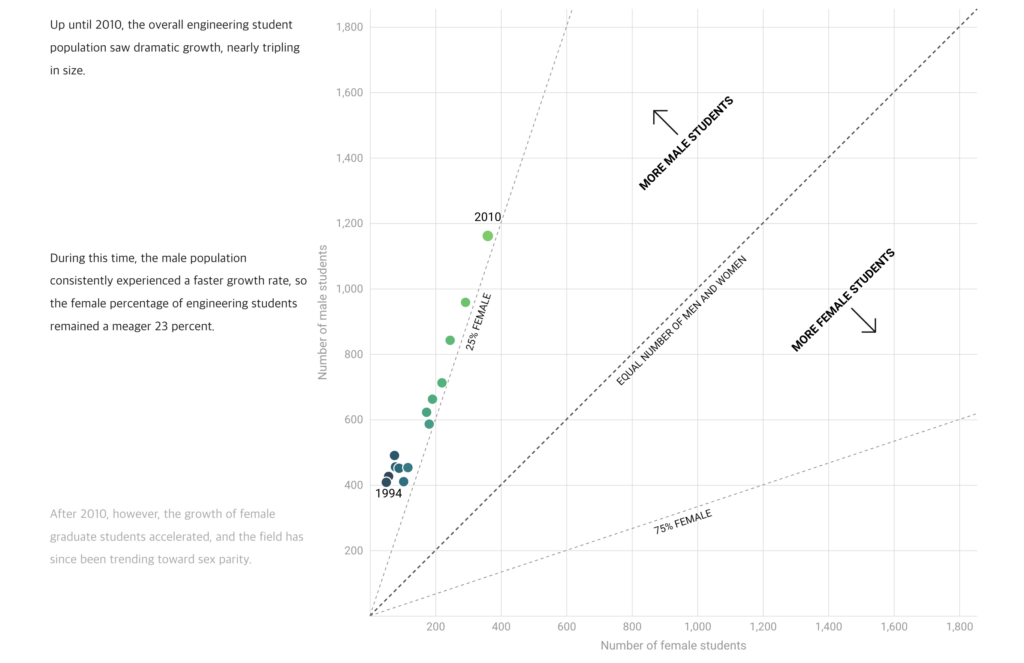
- Compare Columbia’s engineering parity rate (23%→34%) against MIT’s trajectory
Physics’ Rollercoaster
A parallax scroll effect would simulate:
- Ascent (1994-2006): Molecules rising as female PhDs triple
- Peak (2008): Constellation of 37% female representation
- Collapse (2009-2016): Particles scattering downward to 29%
Mathematics’ Quiet Revolution
A cascading equation visualization would incrementally add:
- Statistics’ rebound to parity after 2004 slump
- Applied math’s 13%→42% transformation
- Columbia emerging as Ivy leader by 2016
Computer Science’s Stalled Engine
Hover states on a binary scroll path would reveal:
- 2015-2016 female cohort dropping 73 vs male 31
- 22-year gain of just 3 percentage points
The narrative would conclude with earth sciences’ steady climb to parity (omitted from initial analysis) emerging as viewers scroll past primary content – mimicking how some success stories remain overlooked. Throughout, annotation markers would link to Bridge to PhD program details, emphasizing interventions’ uneven impacts.
The article employs ScrollyTelling to transform a static analysis of gender diversity trends in Columbia’s graduate programs into an engaging, interactive experience. This method combines scrolling text narratives with dynamic visual aids, enabling users to explore data trends across various fields interactively.
Key Interactions in Storytelling:
- Data Visualization Integration: As users scroll through the article, graphs and charts appear alongside text, visually representing trends such as the rise in female representation in mathematics or the decline in physics.
- Field-Specific Exploration: The content is segmented by academic fields (e.g., engineering, computer science), allowing users to focus on specific areas of interest while observing broader patterns.
- Dynamic Contrasts: The scrolling narrative highlights disparities dynamically—for instance, juxtaposing the stagnation in computer science with progress in mathematics—making complex data more digestible.